With the strong support of 10 million users and a database of 25.6 billion keywords, Semrush has emerged as one of the top SEO tools worldwide.
Semrush has a catalog of over 55 tools to perform myriad tasks, from SEO research to content marketing and paid advertising.
This article includes the latest facts and figures about Semrush users, revenue, usage, and more.
Without further ado, let’s dive into it!
Semrush Statistics 2025: Top Picks
- More than 10 million users have used Semrush.
- The number of Semrush paid customers increased to 108,000 in 2023
- In 2025, Semrush is estimated to generate $364 million to $368 million in revenue.
- Semrush generated revenue of $307.675 million in the year 2023.
- In 2023, Semrush earned $337.1 million in annual recurring revenue.
- Semrush’s database contains over 25.6 billion keywords, and in 2025, the platform added 600 million new keywords.
- Semrush has 500TB of raw data.
- Semrush database includes 808 million domain profiles.
Semrush User Statistics
As of December 2024, over 10 million users have used Semrush.
Semrush all-time registrations have increased by more than 233.33% between 2019 and 2025. The significant jump in registration was seen in 2022, when Semrush added 3 million new registrations, touching the milestone of 10 million for the first time.
The following table shows the total number of Semrush registrations since 2019.
| Year | All-time registrations |
|---|---|
| 2024 | More than 10 million |
| 2023 | 10 million |
| 2022 | 10 million |
| 2021 | 7 million |
| 2020 | 5 million |
| 2019 | 3 million |
Free and active customers surpassed one million for the first time in 2023.
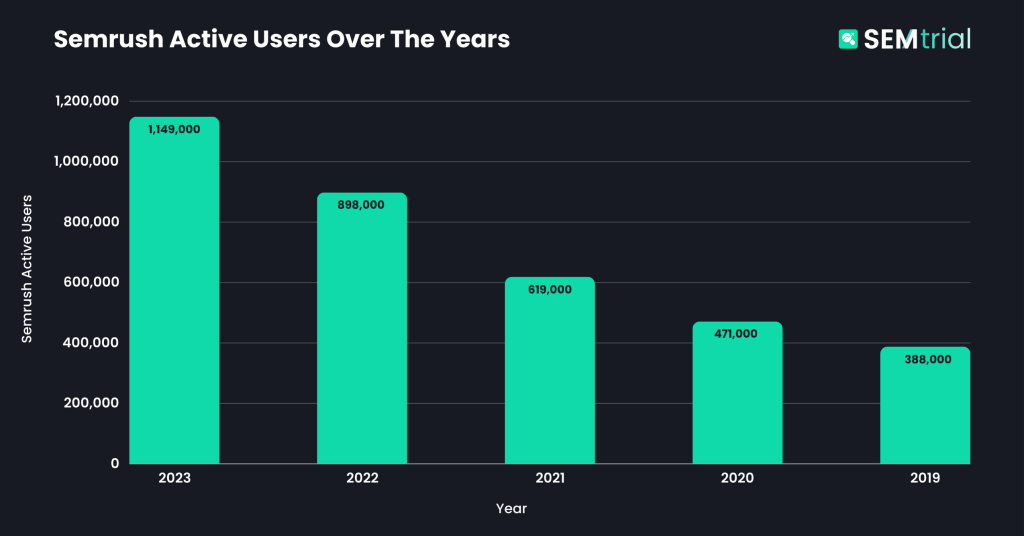
Semrush garnered 1,149,000 active users in 2023 across both free and paid plans. The platform added 251,000 members in 2023 compared to 2022, a 27% increase.
Between 2019 and 2023, the number of Semrush active users increased by 196.134%. The largest increase was in 2022 when Semrush’s active users grew by 279,000 compared to 2021.
Here’s a table showing the number of active Semrush users since 2019.

| Year | Semrush Active Users |
|---|---|
| 2023 | 1,149,000 |
| 2022 | 898,000 |
| 2021 | 619,000 |
| 2020 | 471,000 |
| 2019 | 388,000 |
Source: Semrush, Backlinko
In 2023, the number of paying Semrush customers increased to 108,000.
As of December 31, 2023, the number of paying customers is up by 12.5% from a year ago. On December 31, 2022, the number of paying customers was 96,000.
Most users buy the subscription to Semrush during Black Friday, and Semrush offers the best deals on Black Friday, such as upto 30% discount on all the plans.
Source: Semrush
Semrush Revenue
Semrush expects revenue of $84.7 to $85.3 million for the Fourth quarter of 2024.
This estimate at the midpoint would represent growth of approximately 20% year over year. At the same time, expectations for the fourth quarter 2024 non-GAAP operating margin are approximately 8%.
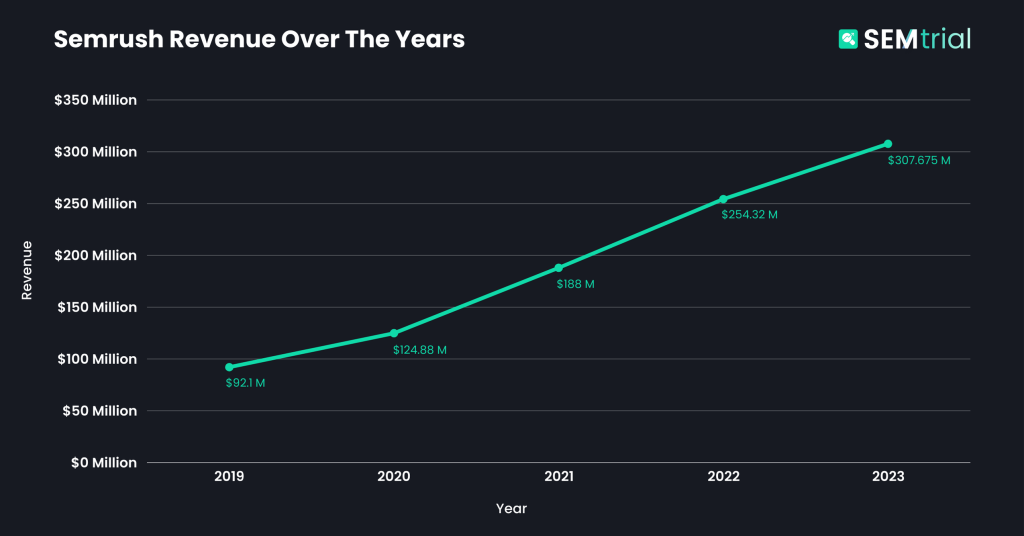
Semrush generated revenue of $307.675 million in the year 2023, a YoY increase of 21%.
The fourth-quarter revenue of the financial year ending in December 2023 was $83.4 million, up 21% from the previous year.
The following table shows the revenue generated by Semrush in the past five years.

| Year | Revenue |
|---|---|
| 2023 | $307.675 million |
| 2022 | $254.32 million |
| 2021 | $188 million |
| 2020 | $124.88 million |
| 2019 | $92.1 million |
Source: Semrush
In 2023, Semrush revenue in the US was $146.4 million.
That was 47.58% of the company’s total revenue. The Semrush revenue from US clients has increased by 22.22% in 2023 compared to 2022.
The Semrush revenue in the US has constantly increased and never depreciated. From 2019 to 2023, it increased by a whopping 247.249%.
The following table shows the revenue from US customers since 2019.
| Year | Semrush revenue ( Share of Total Revenue) |
|---|---|
| 2023 | $146.4 million (47.58%) |
| 2022 | $119.78 million (47.1%) |
| 2021 | $85.64 million (45.55%) |
| 2020 | $57.23 million (45.83%) |
| 2019 | $42.16 million (45.78%) |
Source: Semrush
Semrush registered a revenue of $30.04 million in the United Kingdom in 2023.
This was an increase of 17.02% in 2023 over the last year. In 2023, the share of revenue generated in the UK was 9.76% of the total revenue of Semrush.
Semrush revenue in the UK has been consistently increasing. Between 2019 and 2023, it grew by 194.799%.
The highest jump in revenue collection in the UK was in 2022 when Semrush registered a revenue of $25.67 million as compared to $19.63 million in 2021.
Here is a table showing the revenue from UK customers since 2019.
| Year | Semrush revenue ( Share of Total Revenue) |
|---|---|
| 2023 | $30.04 million (9.76%) |
| 2022 | $25.67 million (10.09%) |
| 2021 | $19.63 million (10.44%) |
| 2020 | $13.16 million (10.54%) |
| 2019 | $10.19 million (11.06%) |
Source: Semrush
Markets excluding the US and UK account for 42.65% of revenue.
This is a staggering amount of $131.22 million. Revenue from the rest of the world increased by $22.35 million, an increment of 20.52% in 2023 compared to 2022.
Semrush’s revenue collection from the rest of the world (excluding the US and UK) increased by 230.03% between 2019 and 2023.
The following table shows the Semrush revenue generated worldwide except in the US and UK.
| Year | Semrush revenue ( Share of Total Revenue) |
|---|---|
| 2023 | $131.22 million (42.65%) |
| 2022 | $108.87 million (42.81%) |
| 2021 | $82.73 million (44%) |
| 2020 | $54.49 million (43.63%) |
| 2019 | $39.76 million (43.17%) |
Source: Semrush
Semrush Net Income
The net income of Semrush for 2023 was about $1.0 million.
Net income increased for the full year 2023, while Semrush experienced a net loss of $33.8 million in 2022.
Semrush experienced a net income of $6.9 million for the fourth quarter of 2023, compared to a net loss of $13.9 million in 2022.
Source: Semrush
Semrush saw a non-GAAP net income of $16.3 million in 2023.
Comparatively, in 2022, the company experienced a non-GAAP net loss of $26.5 million.
Similarly, non-GAAP net income was $11.4 million for the fourth quarter of 2023, compared to a non-GAAP net loss of $11.6 million in the prior year.
Source: Semrush
Semrush Annual Recurring Revenue
Semrush earned $337.1 million in annual recurring revenue in 2023.
In 2023, Semrush added $62 million in a year, and its annual recurring revenue increased by 22.53% compared to 2022.
Between 2019 and 2023, Semrush’s annual recurring revenue increased by 228.558%. The largest-ever increase was in 2021 when Semrush collected $71.5 million more than in 2020.
Here is an overview of Semrush’s annual recurring revenue since 2019.
| Year | Semrush Annual Recurring Revenue |
|---|---|
| 2023 | $337.1 million |
| 2022 | $275.1 million |
| 2021 | $215.7 million |
| 2020 | $144.2 million |
| 2019 | $102.6 million |
Source: Semrush
Semrush’s Annual Recurring Revenue per paying consumer is $3,125.
In 2023, there was an 8.96% increase in ARR per paying customer over 2022. There has been a 65.16% increase since 2019.
The following table shows Semrush’s ARR per paying customer since 2019.
| Year | Semrush ARR per Customer |
|---|---|
| 2023 | $3,125 |
| 2022 | $2,868 |
| 2021 | $2,584 |
| 2020 | $2,123 |
| 2019 | $1,892 |
Semrush Profit
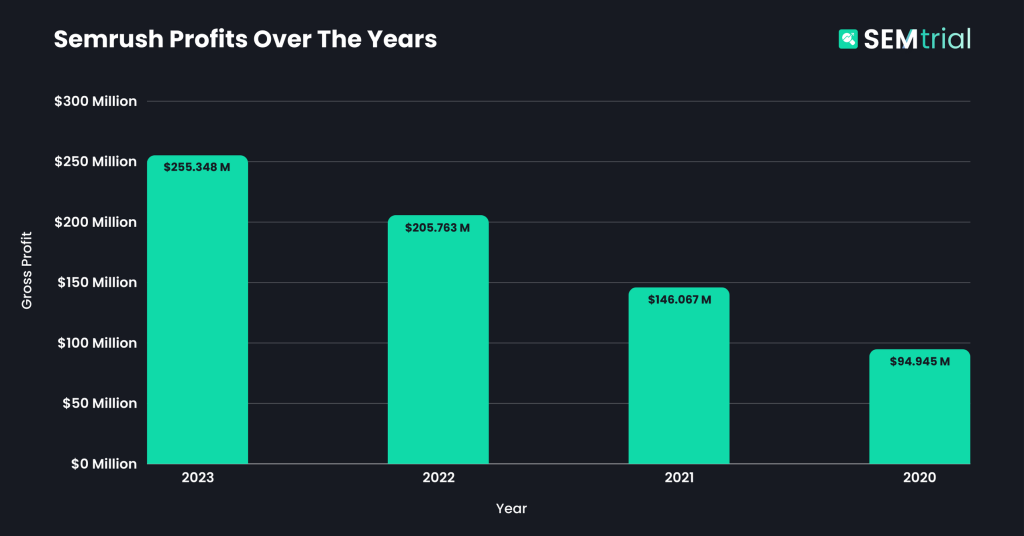
In 2023, Semrush earned $255.348 million in profit.
The profit earned in 2022 was $205.763 million. That displays an increase of $49.585 million in profit in 2023 compared to the previous year, accounting for a growth of 24.09%.
Between 2020 and 2023, the net profit of Semrush increased by 168.94%. The largest jump in the profit was observed in 2022 when Semrush secured $205.763 million, which is $59.696 million more than the $146.067 million secured in 2021.
The following table shows Semrush’s net profit since 2020.

| Year | Gross Profit |
|---|---|
| 2023 | $255.348 million |
| 2022 | $205.763 million |
| 2021 | $146.067 million |
| 2020 | $94.945 million |
Source: Semrush
Semrush SEO Statistics
In 2025, Semrush has more than 55 tools, including everything from SEO research to content marketing.
Semrush had just 2 SEO tools in 2008. There has been a 2650% increase in the number of tools Semrush offers between 2008 and 2025. On average, there has been a 5.3% year-on-year increase in the number of Semrush tools.
Semrush added 12 SEO tools between 2017 and 2018, the largest-ever increase in the SEO tool inventory.
Here is a table showing the growth of Semrush in terms of a number of tools from 2008 to 2025.
| Year | Number of tools |
|---|---|
| 2024 | 55+ |
| 2020 | 50 |
| 2019 | 43 |
| 2018 | 39 |
| 2017 | 27 |
| 2016 | 21 |
| 2015 | 11 |
| 2014 | 8 |
| 2013 | 5 |
| 2012 | 4 |
| 2008 | 2 |
Source: Semrush
Semrush Keyword Database and Research Statistics
As of December 2024, Semrush has over 25.6 billion keywords in its database.
Semrush’s keyword magic tool database is well-known for its mastery of keyword research. With an inventory of 25.6 billion keywords, Semrush makes keyword research very efficient. Semrush offers about 20 million ideas for a single keyword.
The United States has 3.4 billion keywords, which is the highest number of keywords in the Semrush database. Brazil has 2.5 billion keywords, making it the second-largest keyword repository.
The top 10 countries with the most keywords have 15.315 billion keywords in total, contributing 59.82% of the Semrush database’s total keywords.
The following table shows the distribution of keywords across the top 10 countries.
| Country | Keywords |
|---|---|
| United States | 3.4 billion |
| Brazil | 2.5 billion |
| France | 1.6 billion |
| United Kingdom | 1.5 billion |
| Germany | 1.3 billion |
| Canada | 1.2 billion |
| Spain | 1.2 billion |
| Italy | 996 million |
| Australia | 993 million |
| The Netherlands | 626 million |
Source: Semrush
In 2025, Semrush introduced 600 million new keywords in its database.
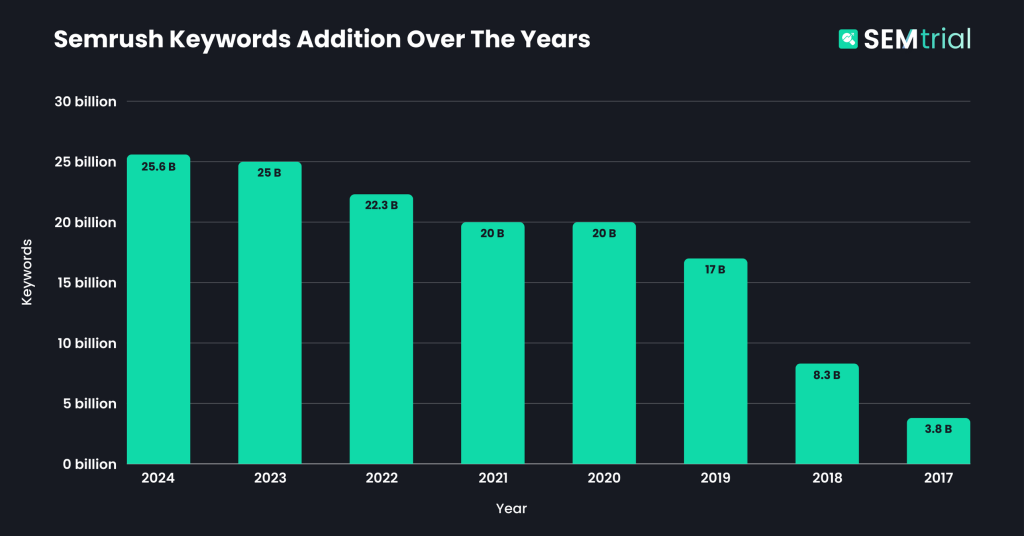
This is a 2.4% increase from the 2023 level. Similarly, Semrush added 12.10% more keywords in 2023 than in 2022.
Between 2017 and 2025, the keywords in the Semrush database increased by 573.68%. In 2020 and 2021, keyword additions to the Semrush database remained constant.
This table shows the growth of Semrush in terms of keywords from 2017 to 2023.

| Year | Keywords in the Database of Semrush |
|---|---|
| 2024 | 25.6 billion |
| 2023 | 25 billion |
| 2022 | 22.3 billion |
| 2021 | 20 billion |
| 2020 | 20 billion |
| 2019 | 17 billion |
| 2018 | 8.3 billion |
| 2017 | 3.8 billion |
Source: Demandsage
As of 2025, Semrush has an inventory of 80.1 million mobile keywords.
The United States alone has 45.1 million mobile device keywords, which is a whopping 56.30% of the global mobile keyword market.
The distant second country with the most mobile keywords is the UK, with 3.6 million keywords. The US has 1152.78% more mobile keywords than the UK.
The following table shows the mobile keyword distribution across the top 10 countries.
| Country | Mobile Keywords |
|---|---|
| United States | 45.1 million |
| United Kingdom | 3.6 million |
| Germany | 3.6 million |
| France | 3.6 million |
| Italy | 3 million |
| Spain | 3 million |
| Canada | 3 million |
| Brazil | 2.9 million |
| Australia | 2.7 million |
| The Netherlands | 2.1 million |
Source: Semrush
Semrush has 543 million desktop keywords.
In this case, too, the US wins, with a maximum of 159 million desktop keywords available.
This is 557.025% more than the UK, which is the second country with the most desktop keywords.
The other top countries with the highest desktop keywords are Germany (24 million), France (23.9 million), and Japan (20.1 million).
The top ten countries with the most desktop keywords cumulatively have 346.9 million desktop keywords, which is 63.88% of the global desktop keywords on Semrush.
The following table shows the desktop keyword distribution across the top 10 countries.
| Country | Desktop keywords |
|---|---|
| United States | 159 million |
| United Kingdom | 24.2 million |
| Germany | 24 million |
| France | 23.9 million |
| Japan | 20.1 million |
| Spain | 20 million |
| Canada | 20 million |
| Brazil | 19.8 million |
| Australia | 18 million |
| India | 17.9 million |
Source: Semrush
Semrush Backlink Database
As of December 2024, Semrush can check 43 trillion backlinks.
With over 43 trillion backlinks, Semrush is the largest database available.
The Semrush database is updated every hour, and the backlink data in the interface is updated every 15 minutes.
Source: Semrush, Semrush
Semrush bots crawl 25 billion URLs per day.
According to a study conducted by Semrush, the Backlink Analytical tool, on average, takes around 40 minutes to report a recently appeared link.

Source: Semrush, Semrush
Semrush Domain Analytics Statistics
As of December 2024, Semrush contains 808 million domain profiles.
Apart from that, the Semrush database also contains 1.6 billion referring domains.
Source: Semrush
In the Domain Analytics Database of Semrush, there are 774 million desktop domain profiles.
The US has the maximum number of desktop domains, which is around 38.8 million. Germany is the second country with the most 16 million desktop domains.
The following table shows the distribution of desktop domains across the top 10 countries.
| Country | Desktop domain |
|---|---|
| United States | 38.8 million |
| Germany | 16 million |
| Canada | 14.9 million |
| United Kingdom | 14.7 million |
| Australia | 12.9 million |
| Spain | 12.9 million |
| France | 12.8 million |
| India | 11 million |
| Brazil | 9.3 million |
| Japan | 9.1 million |
Source: Semrush
Semrush database has 32.1 million mobile domain profiles.
The United States has 9.7 million mobile domains, the most of any country.
The top 10 countries with the most mobile domain profiles have a total of 23.3 million domains. This is 72.58% of the total mobile domains in the Semrush database.
The following table shows the distribution of mobile domains across the top 10 countries.
| Country | Mobile Domain |
|---|---|
| United States | 9.7 million |
| Germany | 2.1 million |
| United Kingdom | 1.8 million |
| Canada | 1.8 million |
| France | 1.5 million |
| Australia | 1.5 million |
| The Netherlands | 1.3 million |
| Spain | 1.3 million |
| Italy | 1.2 million |
| Brazil | 1.1 million |
Source: Semrush
Semrush Usage
Semrush currently has 500 TB of raw website and traffic data.
This 500 TB of data is sourced from over 200 million online panelists in 190 regions and countries worldwide.
On the whole, Semrush analyzes about 1 billion events every single day.
Source: Semrush
Semrush Employee and Office Statistics
As of 2025, Semrush has 1390 full-time employees.
49.5% of those 1390 employees resided in Spain and the United States.
About 35.18%, or 489 of Semrush employees, work in product and development, while another 491 employees (35.32%) work in marketing and sales.
The following table shows the distribution of Semrush employees by country.
| Country | Semrush Employees |
|---|---|
| Spain | 379 |
| United States | 309 |
| The Netherlands | 143 |
| Czech Republic | 131 |
| Cyprus | 126 |
| Other (including remote employees) | 302 |
Source: Semrush
Related Read:
Conclusion: Semrush generated $337.1 million in annual recurring revenue in 2024.
After facing a $33.8 million loss in 2022, Semrush underwent drastic policy changes.
According to Semrush, in 2025, the company is estimated to generate revenue of $364 million to $368 million, which would be a year-on-year growth of approximately 19%.
With an increasing number of users every year, Semrush has become one of the biggest SEO, marketing, and research tools despite not being profitable for the last few years.